TRADER ALPHA / TECHNICAL RESEARCH
Technicals. Levels that matter.
Evidence-led support and resistance, 200-day moving averages, real candlesticks and breakout/retest scenarios. Research, not signals.
INTERACTIVE MARKET CHART
Watch the market, not just the headlines
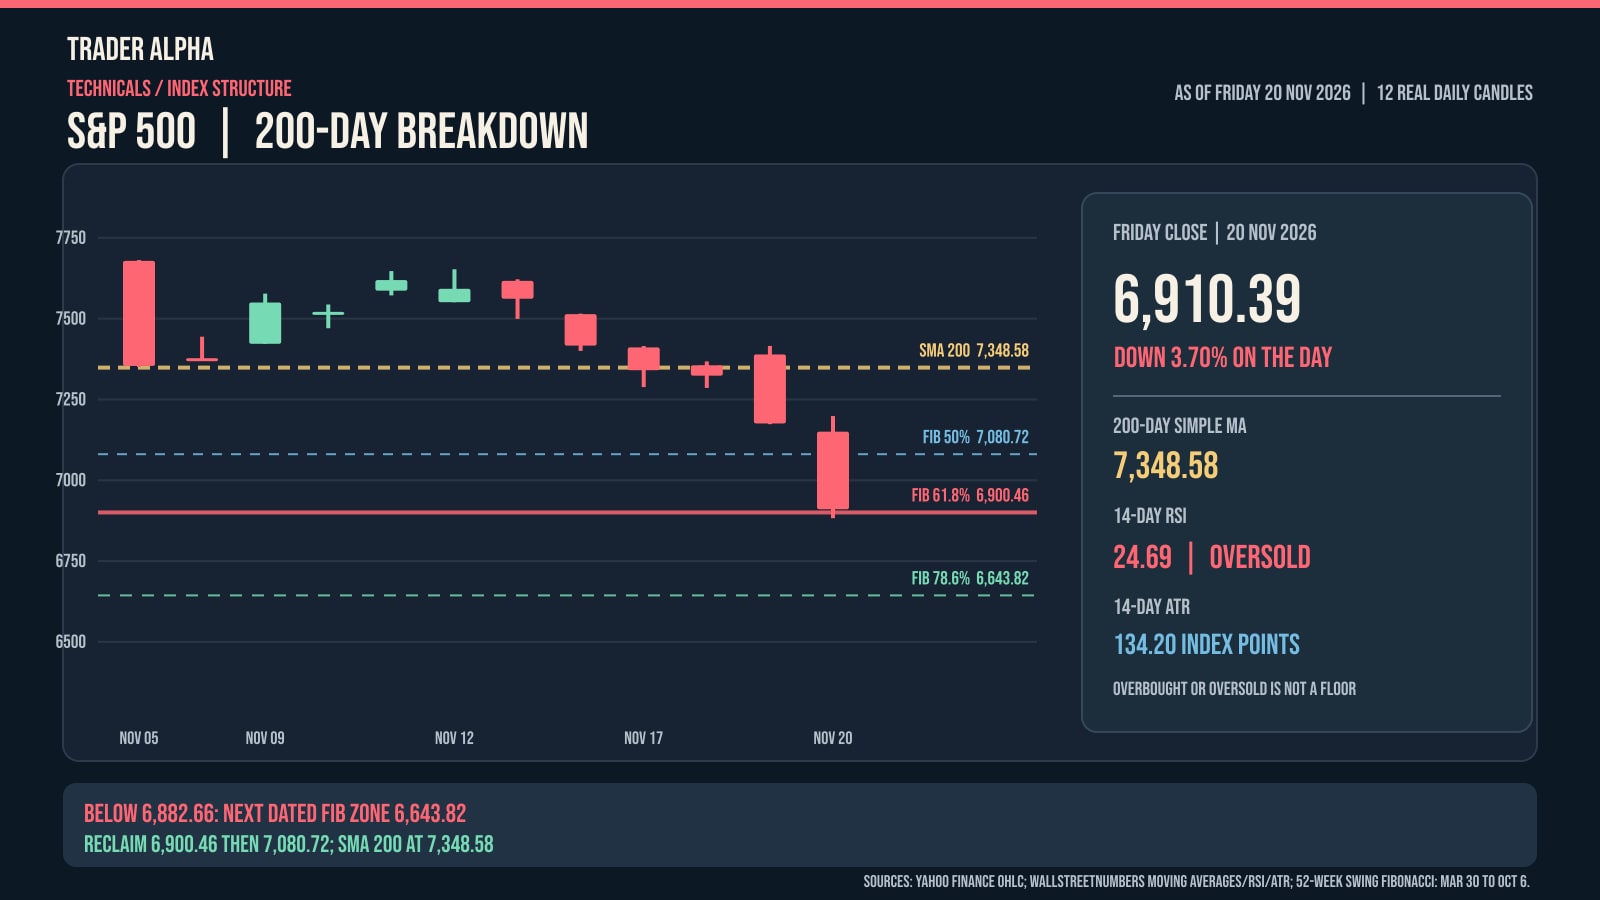
S&P 500 / Historical OHLC chart20 NOVEMBER CLOSE — VERIFIED DATA
Point to, click, or tab onto a candle to inspect its actual OHLC:
Gold: 200-day SMA on 20 Nov, not a fabricated 12-day MA curveBlue/red/green: March–October Fibonacci reference levelsOpen full market chart at TradingView ↗
Interactive charts are provided by TradingView and may require scripts/cookies. Price feeds may be delayed. Dated support/resistance figures in each article do not change with the interactive chart. A moving average is a trend reference, not a guaranteed price floor.
TECHNICAL SETUPS / RESEARCH ARCHIVE
Technical breakdowns, current and archived
Target two or three meaningful setups per trading weekday, provided a verified chart pattern and levels exist. No invented trades or probabilities.
No verified report yet for this market. View all markets.
More charts in Charts and Moving averages explained. Not investment advice.