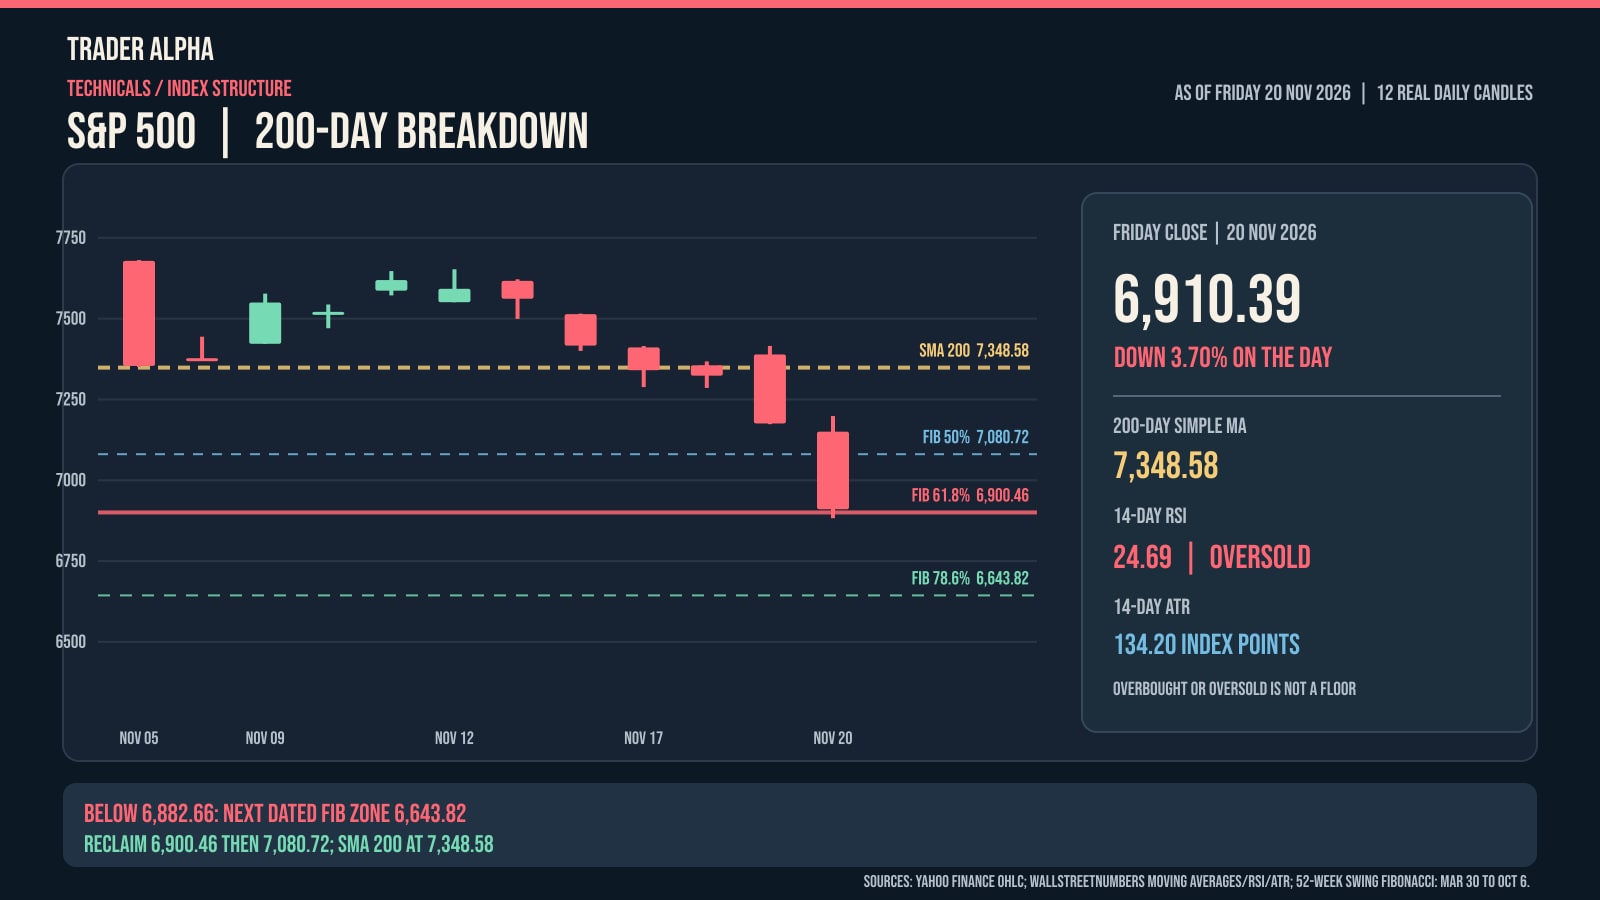
S&P 500 Below the 200-Day Average: Is 6,900 the Dip, or Could 6,644 Be Next?
The S&P 500 closed at 6,910.39, 5.96% below its 7,348.58 200-day average. An original 12-session candlestick chart maps 6,900, 6,644 and the levels bulls must reclaim.
7 min read