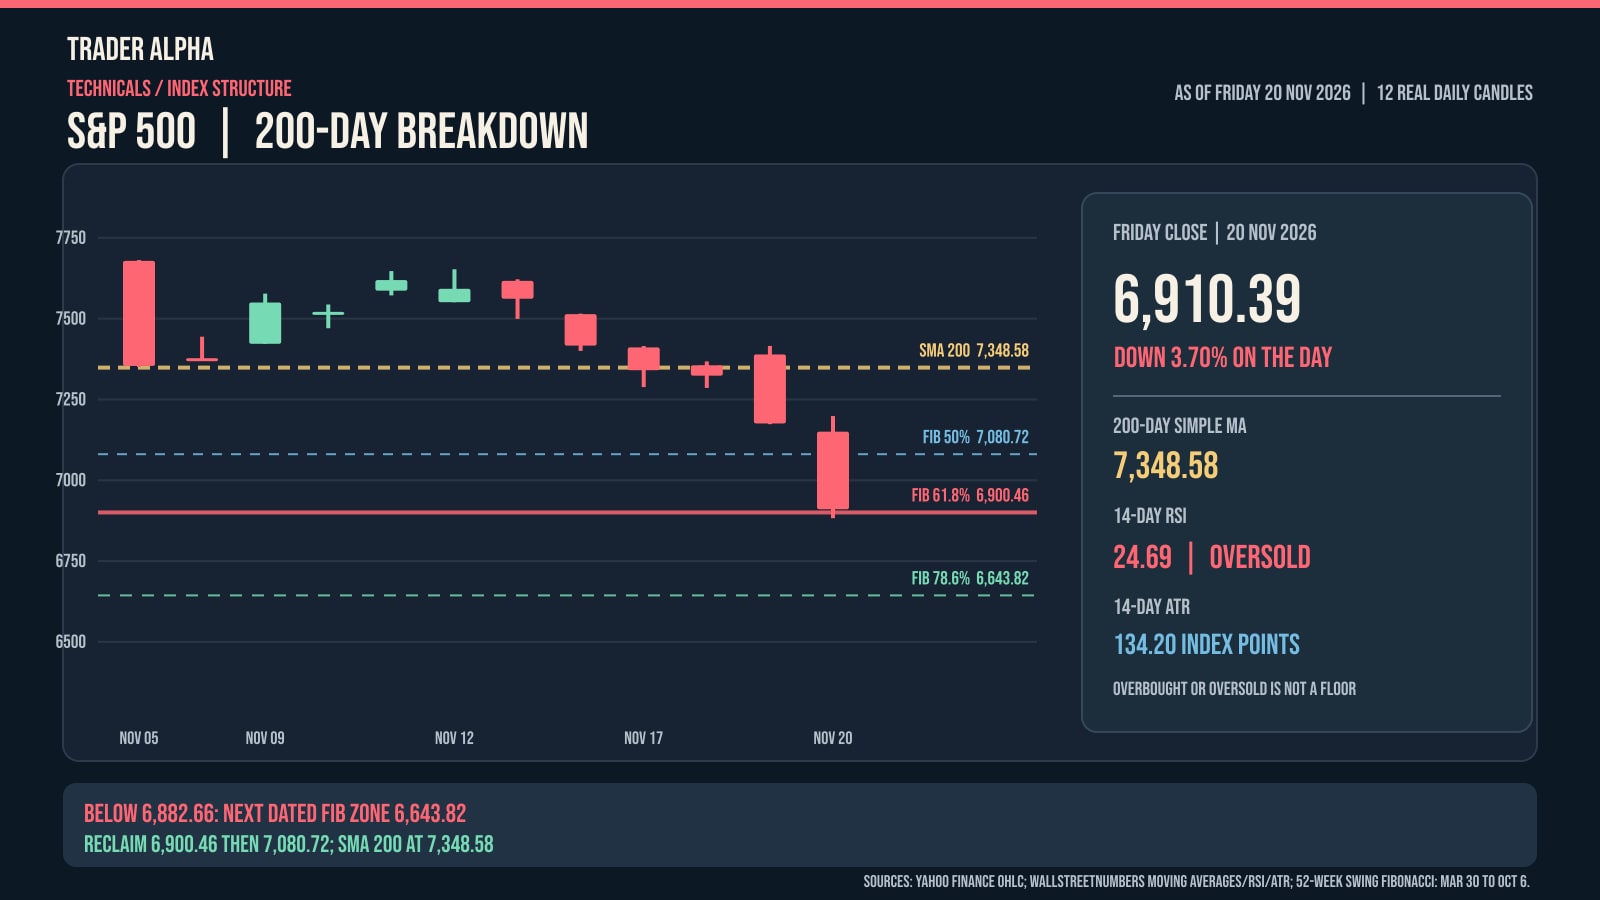
Where could the S&P 500 stabilise after Friday's selloff? The index finished 20 November 2026 at 6,910.39, down 3.70% for the day and 5.96% BELOW its 200-day simple moving average at 7,348.58. That is a loss of 438.19 index points relative to the long-term trend reference. In the same session, the index traded as low as 6,882.66. Those are historical index prices, not live quotes; the nearest downside zones are points to test against future price action, not instructions to buy.
What the chart actually shows
| Reference | Index points | Evidence / interpretation |
|---|---|---|
| 50-day SMA | 7,625.26 | WallStreetNumbers, Friday close; overhead trend reference |
| 20-day SMA | 7,499.23 | WallStreetNumbers, Friday close |
| 200-day SMA | 7,348.58 | WallStreetNumbers; 5.96% above Friday closing price |
| 38.2% retracement | 7,260.97 | 6,316.91 to 7,844.52 March-October swing |
| 50% retracement | 7,080.72 | Same dated swing |
| 61.8% retracement | 6,900.46 | First candidate support/reclaim zone |
| Friday close | 6,910.39 | 20 Nov 2026; Yahoo Finance |
| Friday low | 6,882.66 | 20 Nov 2026; Yahoo Finance |
| 78.6% retracement | 6,643.82 | Downside reference only if decline extends |
| March swing low | 6,316.91 | 30 March 2026, 52-week range low |
| 14-day RSI | 24.69 | Momentum gauge; oversold does not forecast a bottom |
| 14-day ATR | 134.20 | Recent average daily true range in index points |
The 200-day SMA and RSI/ATR are point-in-time indicators, not lines calculated independently from the displayed 12 candles. Fibonacci values are arithmetic retracements of the stated March–October swing; they do not forecast price. SPX index points, not SPY ETF dollars.
A genuine chart, not a support-and-resistance diagram
The original chart below plots 12 real daily SPX open/high/low/close candles from 5 to 20 November, checked against historical market-data tables. The dashed 7,348.58 line is the 200-day SMA as of Friday's close; it is deliberately NOT presented as a full 12-day moving-average curve, which would require all earlier 200-session windows. WallStreetNumbers also reported Friday's 20-day SMA at 7,499.23 and 50-day SMA at 7,625.26. All three sit ABOVE price. That is a meaningful weakening of trend structure, even though moving averages do not act as mechanical barriers.
First potential dip zone: 6,883 to 6,900
The first area is 6,900.46. This is a precisely calculable 61.8% Fibonacci retracement from the 30 March 2026 swing low of 6,316.91 to the 6 October high of 7,844.52. The calculation is 7,844.52 minus 0.618 times the 1,527.61-point advance. Friday actually pierced this level to 6,882.66 before finishing 9.93 points ABOVE 6,900.46. Therefore 6,883-6,900 is a previously tested candidate demand zone, NOT untouched support. A new daily close beneath Friday's low would weaken the case for that first zone holding.
If support breaks: 6,644 and 6,317
If 6,883 fails on a closing basis, the next explicitly derived Fibonacci reference is 6,643.82, the 78.6% retracement of the SAME March-October move. That is about 3.9% below Friday's close. The earlier 30 March low at 6,316.91 is another historic reference, 8.6% below Friday's close. Neither level is a probabilistic price target: the index may reverse earlier, pause between levels, or overshoot both. A 'likely low' cannot honestly be estimated from a two-point Fibonacci formula alone.
Recovery checkpoints: 7,081, 7,261 and 7,349
On a rebound, 6,900.46 is the first reclaim to assess, followed by the 50% retracement at 7,080.72, then the 38.2% retracement at 7,260.97. The 200-day SMA at 7,348.58 is a more important trend-repair milestone; the 20-day 7,499.23 and 50-day 7,625.26 averages are higher overhead references. Bulls would prefer successive daily closes above recovered zones with improving market breadth, not a one-hour wick. A bounce that stalls below 7,081 or 7,349 would leave the broader trend question unresolved.
RSI 24.69 and ATR 134.20: stretched, not necessarily finished
Momentum adds an important second dimension. WallStreetNumbers reports the 14-day RSI at 24.69, below the conventional oversold threshold of 30, and the 14-day average true range at 134.20 index points. An oversold RSI means recent selling has been unusually strong relative to upward moves; it does NOT demonstrate the bottom is in. ATR describes recent daily range and volatility, not the direction of the next candle. A typical-range scale of 134 points is material compared with the roughly 18-point span between 6,900 and the Friday low. Therefore false breakouts and intraday whipsaws are plausible even if the region later proves significant.
What would confirm a bottoming attempt?
What would make a dip-buying thesis more credible? A close and hold above 6,900 after a retest, followed by a recovery through 7,081, plus a higher daily low and broader participation outside a handful of mega-cap shares. What would weaken it? Repeated closes below 6,883, falling highs on attempted bounces, and further breakdowns in equally weighted indices or market breadth. These conditions are observable; phrases such as 'buy the bottom now' or 'the candle gives a 70% win rate' are not supported by this report.
What historical moving-average breaks can really tell us
The historical caveat matters. MarketWatch discussed a limited comparison of prior first breaks under the 200-day average after prolonged periods above it. Such events are not interchangeable across valuation regimes, interest rates, sector concentration or volatility. We have not independently conducted a full event-study backtest here, so we are NOT claiming a statistical bounce probability. This is a price-level decision map: a dated closing snapshot, reproducible Fibonacci maths, publicly reported momentum values and conditions that would change the interpretation. The embedded TradingView chart below provides a separate current view that may be delayed.
Sources and further reading
Yahoo Finance — S&P 500 daily OHLC history, 5–20 November 2026 ↗WallStreetNumbers — SPX moving averages and momentum, 20 November 2026 ↗WallStreetNumbers — SPX 14-day RSI history ↗Frenzy Capital — 52-week SPX swing and Fibonacci retracement values ↗StockCharts — S&P 500 200-day moving average breakdown ↗MarketWatch — Historical context for 200-day moving average breaches ↗TradingView — Official chart widget documentation ↗Published Sat, 21 Nov 2026 07:51:00 GMT. This article used AI-assisted drafting. Figures refer to the dates in the text.