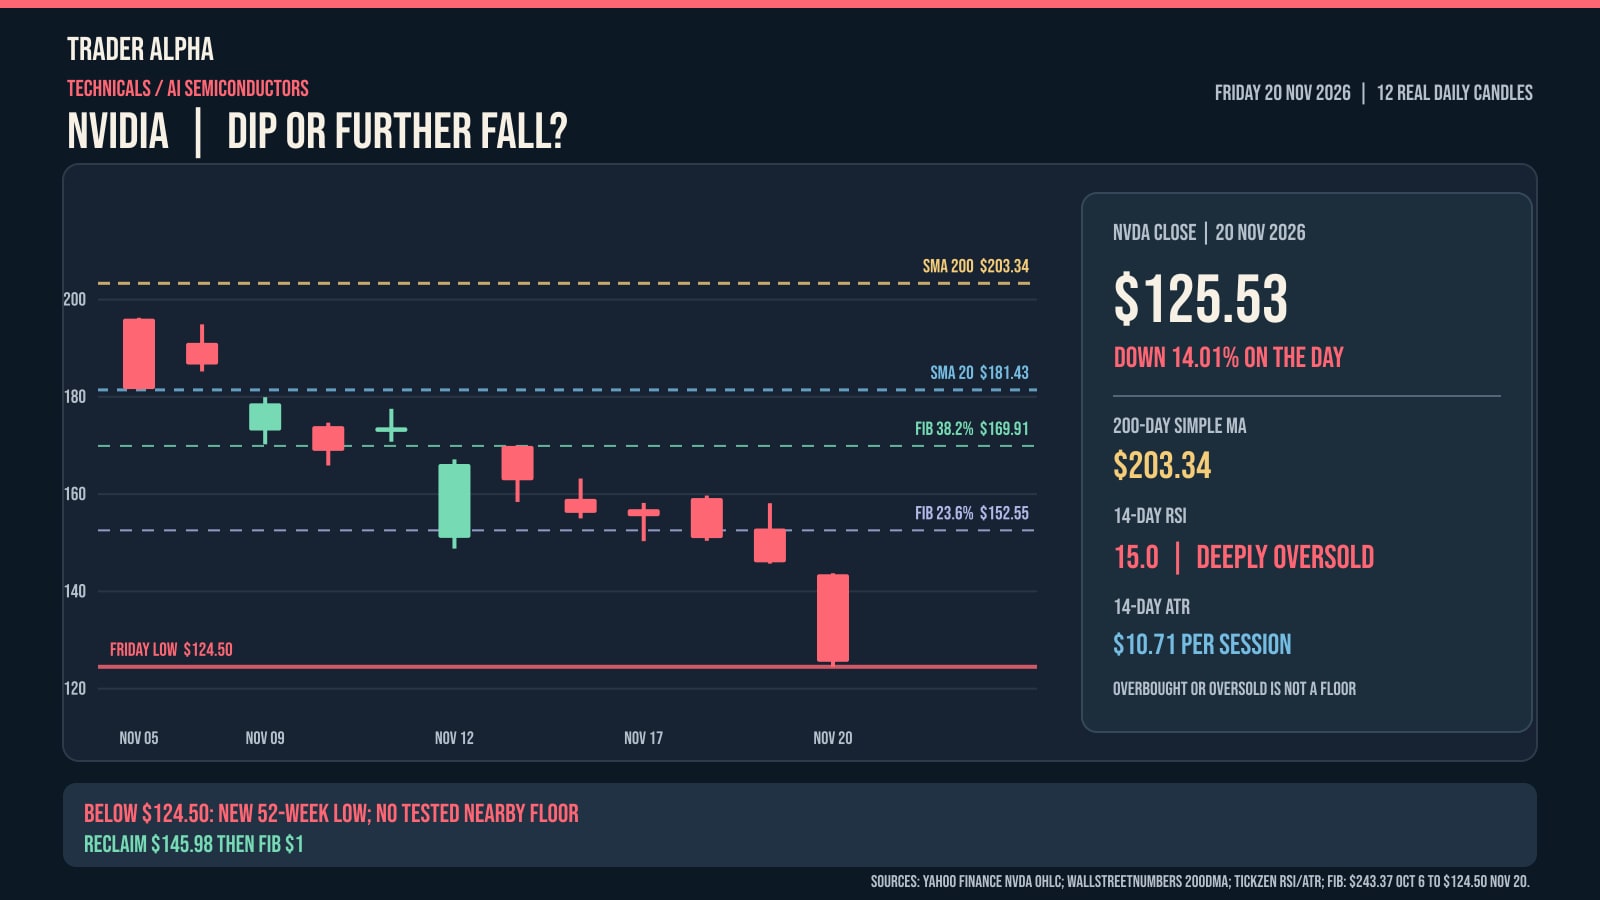
Nvidia closed Friday 20 November 2026 at $125.53, down 14.01% on the session, after trading as low as $124.50. That was also its new 52-week low, according to the Yahoo Finance and Stock Analysis daily histories. What would make a dip-buying attempt more credible after such a violent move? The first fact is that price is at the lower edge of its observed annual range, so there is no established nearby 52-week support below $124.50. The chart below plots twelve real daily open/high/low/close candles from 5–20 November; it does not invent a support line beneath the day's low.
What the chart actually shows
| Reference | USD level | What it measures |
|---|---|---|
| 20-day SMA | $181.43 | WallStreetNumbers, as-of Friday close |
| 200-day SMA | $203.34 | WallStreetNumbers; price about 38.3% below |
| Friday close | $125.53 | Yahoo Finance, 20 Nov 2026 |
| Friday actual low | $124.50 | Yahoo Finance; new observed 52-week low |
| Friday intraday high | $143.73 | Yahoo Finance; potential reclaim threshold |
| 19 November close | $145.98 | Yahoo Finance; prior-close reference |
| 23.6% rebound retracement | $152.55 | Oct 6 $243.37 to Nov 20 $124.50 swing |
| 38.2% rebound retracement | $169.91 | Same dated swing; near 13 Nov $170 high |
| 50% rebound retracement | $183.94 | Same dated swing |
| 61.8% rebound retracement | $197.96 | Same dated swing |
| RSI (14) | ~15 | Tickzen/SwingTradeBot; deeply oversold |
| ATR (14) | ~$10.71 | Tickzen; recent daily price-range scale |
Daily USD cash-equity bars from Yahoo Finance, price and moving-average/indicator sources as cited. Fibonacci values are derived from fixed dated swing endpoints; they do not forecast probabilities or returns.
This investigation cannot be settled by a price chart
The selloff comes amid broader weakness in AI infrastructure shares and Reuters reporting about an SEC inquiry focused on potential Nvidia accounting issues. A reported investigation is not evidence of an accounting violation. Technical analysis cannot resolve the allegations; it can only show how market participants are trading around a dated event. One-day declines of 14% are also vulnerable to noisy opening gaps, wide spreads and rapidly changing sentiment, so a single green candle would not establish a lasting low.
Trend damage: a 200-day SMA near $203
The long-term moving-average gap is stark. WallStreetNumbers reported Nvidia's 200-day simple moving average at $203.34 at Friday's close, about 38.3% ABOVE the $125.53 price on a price-relative basis. The 20-day average was $181.43 and the 50-day average $206.99. These are each the provider's as-of-close indicator values; they are drawn as STATIC reference lines in the original chart, not as fictional full moving-average histories calculated from only twelve candles. Until price recovers important shorter-term averages, a positive intraday bounce can coexist with a deeply damaged trend.
RSI near 15: oversold does not mean safe
Momentum is even more stretched than the S&P 500. Tickzen's 20 November daily technical snapshot put Nvidia's 14-day RSI around 15.0, a very low reading, with ATR(14) around $10.71. SwingTradeBot's daily figures also showed a sub-20 RSI and about $10.70 ATR, although providers differ slightly in calculation and data cut-off. RSI below 30 is conventionally termed oversold; RSI near 15 is extreme, but it is not a quantified probability of a rebound. ATR near $10.7 is about 8.5% of Friday's closing price: large daily swings are consistent with the current volatility regime.
The actual low is $124.50; below that is uncharted nearby ground
The closest level on the downside is the *actual* Friday low at $124.50. If new closes break beneath that level, there is no proven next 52-week support to confidently quote from this short chart. Round numbers such as $120 are sometimes watched psychologically, but they are not independently validated historic demand zones. A higher-low formation or a daily recovery back above Friday's $143.73 intraday high would provide stronger evidence that buyers are defending a level than speculation about an arbitrary 'last chance' price.
Fibonacci recovery zones: $152.55 and $169.91
To map a possible recovery rather than invent downside targets, take the observed 6 October 2026 peak of $243.37 and Friday's $124.50 low, a $118.87 decline. A 23.6% rebound retracement would be $152.55 and a 38.2% retracement would be $169.91. The 50% midpoint is $183.94 and the 61.8% level is $197.96. The 38.2% level happens to sit close to Nvidia's observed $170.00 high on 13 November, but that coincidence is not a trading edge. These zones are arithmetic recovery checkpoints; they do not forecast that prices will reach them.
What would confirm a recovery attempt?
The near-term bull case would be a confirmed higher daily low above $124.50, then a sustained reclaim through $143.73–$145.98 (Friday's high and Thursday's close), followed by the $152.55 Fibonacci level. A failed rebound beneath those prices, or a fresh close below $124.50, would weaken that case. Even a rise through $169.91 would leave the 20-day SMA around $181.43 overhead. Since an index-wide selloff also occurred on Friday, monitor semiconductor-sector breadth and the Nasdaq as well as the Nvidia candle before attributing a change to company-specific news.
How trader discussions can mislead
Reddit and Stocktwits discussions about Nvidia's probe and Friday's slide contain both dip-buying speculation and warnings about further selling. Those are individual, self-selected messages, not evidence that a low has formed. The question to ask is not 'will this candle bounce?' but 'what set of closing prices, volume conditions and wider-market data would distinguish a short-covering reaction from a durable recovery?' This article provides a dated evidence map rather than a buy recommendation. The TradingView widget below offers a separate live/delayed chart, and levels should be re-evaluated with fresh bars.
Sources and further reading
Yahoo Finance — NVDA historical OHLC through 20 Nov 2026 ↗Stock Analysis — NVDA historical closing prices and volume ↗WallStreetNumbers — Nvidia moving average history, 20 Nov 2026 ↗Tickzen — NVDA technical indicators, RSI, ATR, volume ↗SwingTradeBot — Nvidia daily technical indicators as of 20 Nov ↗Reuters — SEC investigation report and separate broader market context ↗Reddit r/stocks — public trader discussion of Reuters, not market evidence ↗Published Sat, 21 Nov 2026 09:43:00 GMT. This article used AI-assisted drafting. Figures refer to the dates in the text.