Trader Alpha
メニュー
TRADER ALPHA / TECHNICAL RESEARCH

Technicals. Levels that matter.

Evidence-led support and resistance, 200-day moving averages, real candlesticks and breakout/retest scenarios. Research, not signals.

INTERACTIVE MARKET CHART

Watch the market, not just the headlines

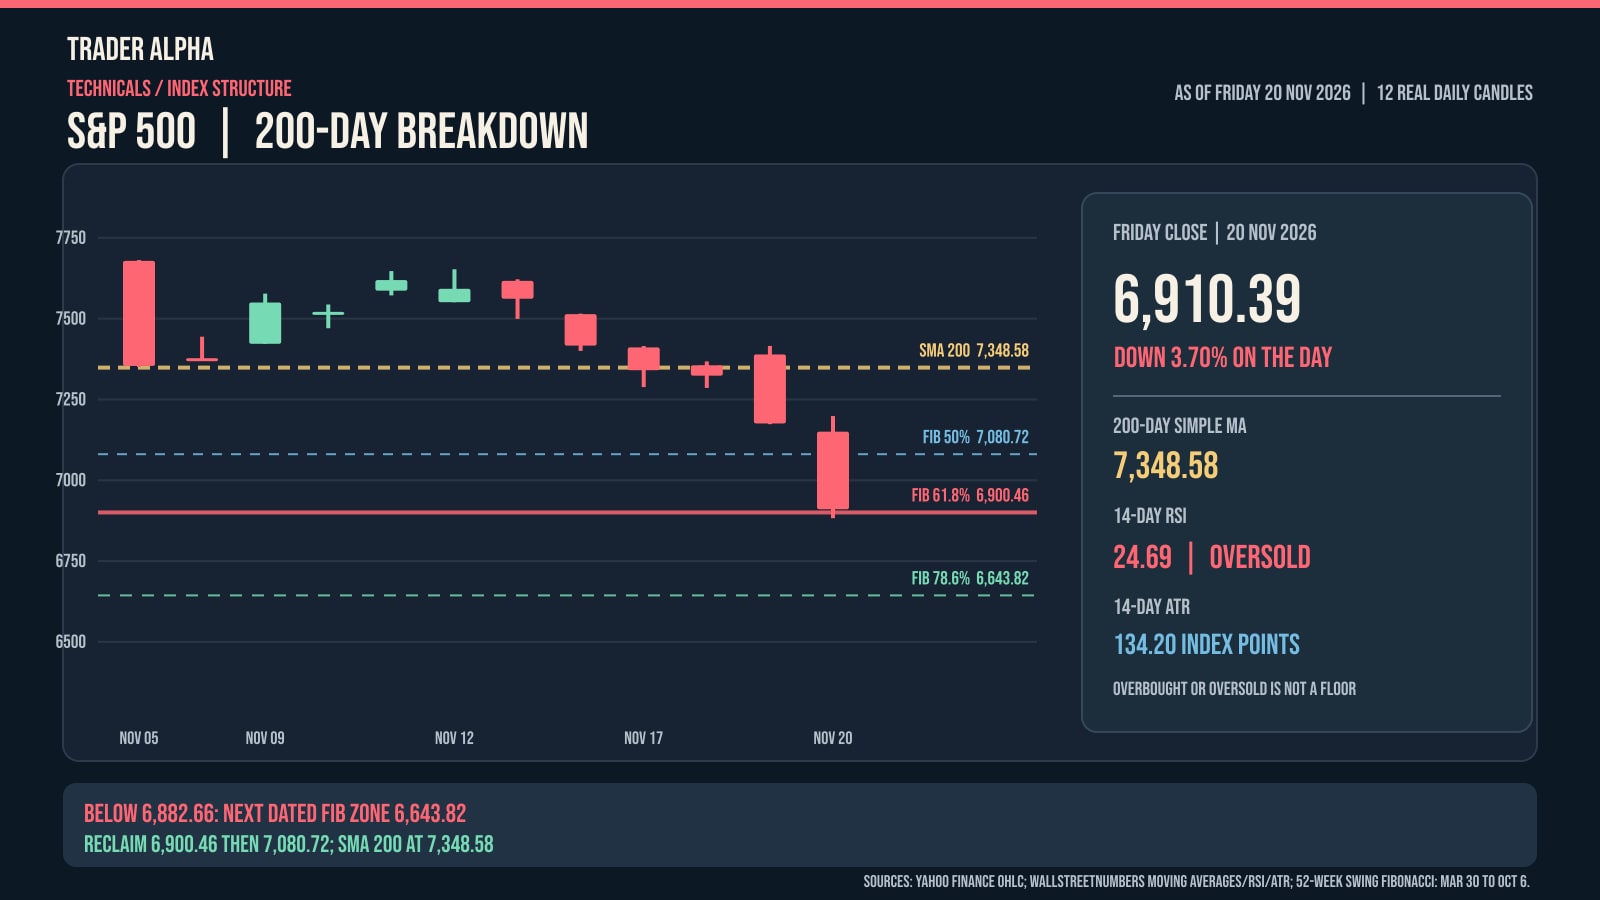
Original SPX daily candlesticks for 5 to 20 November 2026 and dated 200-day SMA, RSI, ATR and Fibonacci support levels
Dated research snapshot, not the current price. Read the complete support, resistance and momentum analysis ↗
S&P 500 / Historical OHLC chart20 NOVEMBER CLOSE — VERIFIED DATA
SPX / 12 VERIFIED DAILY CANDLES20 NOV 2026 CLOSE 6,910.396,5006,7507,0007,2507,5007,750200D SMA 7,348.5850% FIB 7,080.7261.8% FIB 6,900.4678.6% FIB 6,643.825 NOV 2026 | Open 7,678.72 | High 7,681.29 | Low 7,350.35 | Close 7,353.736 NOV 2026 | Open 7,377.65 | High 7,444.20 | Low 7,369.55 | Close 7,376.869 NOV 2026 | Open 7,422.24 | High 7,577.39 | Low 7,422.24 | Close 7,549.9410 NOV 2026 | Open 7,513.09 | High 7,543.92 | Low 7,470.43 | Close 7,520.9311 NOV 2026 | Open 7,586.65 | High 7,647.20 | Low 7,571.88 | Close 7,619.3812 NOV 2026 | Open 7,550.84 | High 7,652.76 | Low 7,550.84 | Close 7,592.4013 NOV 2026 | Open 7,616.85 | High 7,621.78 | Low 7,499.40 | Close 7,561.6716 NOV 2026 | Open 7,513.98 | High 7,515.60 | Low 7,400.15 | Close 7,416.5917 NOV 2026 | Open 7,411.02 | High 7,415.37 | Low 7,288.34 | Close 7,340.5318 NOV 2026 | Open 7,355.69 | High 7,367.68 | Low 7,285.76 | Close 7,323.6319 NOV 2026 | Open 7,389.26 | High 7,415.64 | Low 7,173.63 | Close 7,175.8320 NOV 2026 | Open 7,150.39 | High 7,198.67 | Low 6,882.66 | Close 6,910.395 NOV9 NOV11 NOV13 NOV17 NOV19 NOV20 NOVLONG-TERM TREND7,348.58200-DAY SMA (SNAPSHOT)RSI (14)24.69Oversold does not mean bottomATR (14)134.20Index points / volatilityNEXT FIB IF 6,883 FAILS6,643.82SOURCE: YAHOO FINANCE OHLC. SMA, RSI, ATR AND FIBONACCI ARE DATED VALUES, NOT LIVE FORECASTS.

Point to, click, or tab onto a candle to inspect its actual OHLC: 20 NOV 2026 | Open 7,150.39 | High 7,198.67 | Low 6,882.66 | Close 6,910.39

Gold: 200-day SMA on 20 Nov, not a fabricated 12-day MA curveBlue/red/green: March–October Fibonacci reference levelsOpen full market chart at TradingView ↗

Interactive charts are provided by TradingView and may require scripts/cookies. Price feeds may be delayed. Dated support/resistance figures in each article do not change with the interactive chart. A moving average is a trend reference, not a guaranteed price floor.

TECHNICAL SETUPS / RESEARCH ARCHIVE

Technical breakdowns, current and archived

Target two or three meaningful setups per trading weekday, provided a verified chart pattern and levels exist. No invented trades or probabilities.

More charts in Charts and Moving averages explained. Not investment advice.